
There have been five major tax cuts since the income tax was established in 1916.
When this new Republican/Trump tax bill passes, it will be the sixth.
Every major tax cut bill has been sold as good for the economy. Since Ronald Reagan, they even have promotional titles—The Economic Recovery Act; Economic Growth and Tax Relief Reconciliation Act; Jobs and Growth Tax Relief Reconciliation Act; Tax Cut and Jobs Act— there to tell us that politicians who pass them are actually well-intentioned and to convince us that these bills will be good for all of us.
What they’ve actually delivered are two big disasters, one medium disaster, and two long term bouts of inflation.
#1: The Roaring Twenties
In 1918, the final year of the First World War, the top marginal tax rate was 77%.
Marginal tax rates work like a layer cake. The government takes a small bite of the lowest layer, then bigger bites of every layer above that. Let’s say you were wildly wealthy back in 1918, you would only be paying 6% on your first $40001. Then you would pay higher rates, as slice was piled upon slice, until your income was a million dollars. That’s about $21 million in today’s dollars. That 77% marginal rate would only kick in from there on up.
In 1919, the top rate went down to 73%. The big cuts started in 1922. By 1925 the top rate had gone down in four steps to 25%. There would be one last tax cut, in 1929, to 24%.
Real technology booms were taking place. Electricity made it possible to turn radios, telephones, the movies, and appliances, into major industries. Assembly lines changed automobiles and a host of other products from hand-crafted luxury items to affordable mass-produced goods. Aircraft transitioned from military to commercial uses. Businesses moved to mass marketing, new advertising mediums, and consumer credit. Such things required better infrastructure, paved roads, power plants and power lines, distribution networks, broadcast towers, and movie theaters.
There was also a boom in the financial sector.
By 1927, you could watch the financial boom turning into a bubble. Shoeshine boys were touting stocks. New financial instruments were being invented. Over the next two years the Dow Jones Industrial Average went up almost 150%.
In 1929, the stock market crashed. The Dow Jones plunged almost 50% in two months. Then went down even more. By 1932 it had gone from a high of 381 down to 41, a loss of 89%. Then, as now, the Dow Jones represented the good stuff. There were lots of other stocks that did far worse.
Back in the 1920’s, most banks were small, branch banking was just getting started, and there was very little regulation. As a result, there were lots of banks—over 30,000 in 1921—and lots of bank failures—about 650 a year. After the crash, the number of bank failures went up into the thousands. It culminated with an estimated 4,000 in 1933. President Roosevelt had to shut down the whole banking system in order to stop the collapse and save the system. Banks were inspected. Those that were found to be reasonably sound were allowed to reopen backed by government funds, which restored faith in the system. That informal impulse was almost immediately replaced by legislation that separated out the different forms of banking—commercial, investment, savings and loans, credit unions—with appropriate regulations and insurance that protected depositors.
By then, the Great Depression was fully under way.
The US didn’t get to full recovery until it entered the Second World War in 1941.
That’s the fundamental sequence. Tax cuts at the top. Boom in finance. Bubble. Crash. Massive bank failures. Depression or Recession.
#2: The Reagan Revolution—Mourning in America?
From 1964 through 1980, the top marginal tax rate was 70%, with some brief visitations to 75.25%, to 77%, and 71.75%.
In 1982 the top rate went from 70% down to 50%. In 1987 it went down to 38.5%, and finally to 28% in 1988.
In the early 80’s the Dow Jones was bouncing around between 700 and 900. In 1982 it started to climb. It really took off in 1985. In 1987 it went over 2700.
Then came “Black Monday,” October 19, 1987.
The New York Stock Exchange fell 22.61%. That still holds the record as the biggest one-day collapse.
Bank failures had almost been eradicated. Under the New Deal regulations, it was as if bankers were lined up in banker school and vaccinated against recklessness and irresponsibility. But the theology that calls for tax cuts always cries out for deregulation. In 1982, Reagan also signed the Garn-St. Germain Depository Institutions Act. He called it “the most important legislation for financial institutions in 50 years.” That was true, though not in a positive sense.
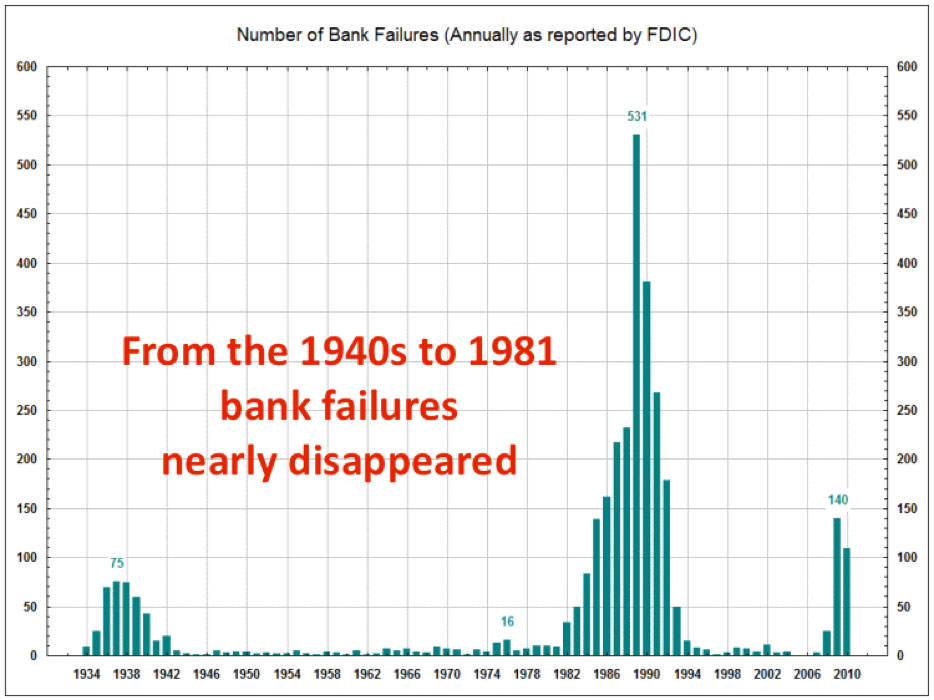
Bank failures were back. Big time. At the start of the crisis, there were 3,364 Savings & Loans. Nearly 40%, 1316 of them, failed2. Others were absorbed or merged. By the time it was over, only half of them were left3.
S&Ls had been the small, secure, safe, boring, assets-to-the-community institutions depicted in It’s a Wonderful Life with Jimmy Stewart. Garn-St. Germain changed all that.
Instead of a minimum of 400 shareholders, just one person could own a bank. He didn’t have to put up cash to do it. Borrowers didn’t have to put up anything either. They could get 100% financing. S&Ls had been required to make their loans locally. Now they could make them anywhere. They went from Generally Accepted Accounting Principles to the bank board’s Regulatory Accounting Principles or to Creative Regulatory Accounting Principles, from GAAP to RAP and CRAP.
The rule changes were invitations to fraud. They were widely and gleefully accepted. Virtually every bank that failed had been committing fraud4.
Even though depositors had been covered by the FDIC, the failures were so huge that there had to be a bailout. The price was $132,000,000,0005. Back in our naïve and innocent days at the end of the 20th Century, $132 billion actually seemed like a lot.
A recession followed. Though not until Reagan’s successor, George H.W. Bush was in office. It was relatively brief and shallow.
#3 Double W Bush
Bush the Younger came into office in 2001. The first thing he did was pass a tax cut bill. It cut the top marginal rate from 39.6% to 38.6% in two steps. He pushed through another tax cut in 2003. It took the top rate down to 35%. That one also cut the taxes on dividends and on capital gains. Dividends had been taxed as regular income. If you were in the top bracket in 2002, taxes on dividends would have been 38.6%. In 2003, that rate was cut to 15%. The rate on long term capital gains—the amount of profit from selling something held for a year or more—was reduced from 21% to 16%. These are taxes exclusively on money made from money. By definition, tax cuts for the Investor Class.
The average savings from the Bush tax cuts for people making over $1,000,000 a year was $110,000 a year.
The stock market, real estate, and all kinds of exotic financial instruments, boomed. The real economy stayed flat. It was called the Bush Boom or the Jobless Recovery, depending on who was looking at it.
That Crash came in 2008.
On September 18, 2008, Ben Bernanke, Chairman of the Federal Reserve, told congressional leaders, “The kind of financial collapse that we’re now on the brink of is always followed by a deep, long recession. … If we aren’t able to head this off, the next generation of economists will be writing not about the thirties but about this. …You could see a twenty-per-cent decline in the stock market, unemployment at nine to ten per cent, the failure of G.M., certainly, and other large corporate failures. It would be very bad.”
Hank Paulson, Secretary was also at the meeting. He said, “Unless you act, the financial system of this country and the world will melt down in a matter of days. “
Then Bernanke said, “If we don’t do this tomorrow, we won’t have an economy on Monday.”
Congress and President Bush were convinced. There would be a bailout. It’s announced price was $700 billion. That was sleight of hand. Done with a usefully abstruse title, TARP, the Toxic Assets Relief Program. Afterward, the Special Inspector General for TARP put the actual figure at $16.8 trillion. A paper from the Levy Institute at Bard College said it was $29 trillion6. Yes, folks, trillions.
They saved the banks. They saved the top executives at those banks. They even saved the bonuses of the people at those banks who’d led the economy over the cliff. And all the other disasters that Bernanke rang the alarms about in order to make the bailout happen still came to pass. But worse. Instead of a mere 20% decline in the stock market, the fall was more than 30%, calculated from where it had been in September, 2008. And if you calculated from the market’s peak, a year earlier, in September, 2007, it was more like 50%7. Unemployment hit the high end of his estimate, 10%8. More if you were African-American, Latino, a man, lived in Nevada or California or several other states. Employment fell faster than in previous recessions9 and unemployment lingered longer. Yes, General Motors failed. Chrysler did, too. Approximately 170,000 small businesses went under from 2008-201010.
What followed was called the Great Recession.
The basic pattern is: Tax Cuts for the Rich, Boom, Bubble, Crash—including massive bank failures—Depression or Recession. Why does it keep happening? Has the repetition of this pattern in three out of the only five times we’ve had major tax cuts been mere coincidences?
Or do Tax Cuts for the Rich actually cause Boom, Bubble, Crash—including massive bank failures—Depression or Recession.
What about the two other times?
Most economic ideas, like political, moral, and theological ideas, don’t exist in isolation. Cutting taxes on the rich lives in a cozy cluster along with beliefs that both taxes and government spending take money from what the economy should be, that Free Markets will do it all better, that government should be smaller, that people who need government services probably don’t deserve them, and if you have money you deserve it. The absolute norm for tax cut proponents is also to shrink the government. Cut spending. Especially spending that could be characterized as welfare—medical care, education, veterans care, retirement income, school food.
The first exception took place in the 1960’s. We’re at the tail end of the second. Both of those tax cuts were accompanied by massive increases in government spending which went to a broad spectrum of society. Lyndon Johnson and Donald Trump. Their intentions and sentiments were radically different. But their economic actions—in the most macro sense—turn out to have been extremely similar.
Let us go back to the middle of the 20th Century.
From 1945-1963 the top marginal rate was 91%11.
Johnson put through cuts in 1964 and 1965 that reduced the top rate to 70%. People who praise them almost always call them the Kennedy tax cuts, I’m guessing it’s because they find Kennedy to be stylish and are reluctant to embrace anything that Johnson did.
Johnson does not appear to have really cared about the tax cuts. Though when they were praised he was happy to take the credit for them. What Johnson cared about was what he called The Great Society, finishing the undone tasks of the New Deal with Medicare, Medicaid, increased Social Security, Food Stamps, aid to education, and the War on Poverty. Plus, he had a war. We tend to think of wars as costly wastes of money. But they involve lots of spending on industrial products. Sure, you blow them up, but that means they have to be made over and over again. They also create as near to full employment for young males as anyone’s ever likely to get.
Trump was very eager to put through his Tax Cut and Jobs Act of 2017. It cut the top marginal rate from 39.6% to 37%. Corporate taxes had been levied in tiers going from 15% to 39%. That was replaced by a flat rate of 21%. The taxes on a corporation paying the top rate were cut nearly in half. American Progress’ estimate is that it saved people right in the middle $900 per year, the top 1% saved $61,090 per year, and people in the top 0.1% received an extra $252,300 per year. The bill contained all sorts of other nips and tucks.
Trump had no intention of being another Lyndon Johnson. He was going in the other direction. He tried to repeal the Affordable Care Act, and cut Medicare and Medicaid. Then came COVID. That brought on the CARES Act, a $2.2 trillion stimulus package. The biggest in US history. It included $1200 for anyone who submitted a tax return, forgivable loans for small businesses, money to health care, hospitals, medical industries, expanded unemployment benefits, student grants and loans, and a host of other things. Two years later he lost the presidency to Joe Biden who very much wanted to be the successor to FDR and LBJ. He followed up the CARES Act with the $1.9 trillion American Rescue Plan Act of 2021.
Intentions aside, the policy effects on the volume of movements of money into and out of the government under Johnson and Trump plus Biden are very similar.
Why didn’t the sequence—Tax Cuts for the Rich, Boom, Bubble, Crash—including massive bank failures—Depression or Recession—happen these two times?
The Rich are the Investor Class.
By definition, they have more money than they need. More, even, than for a Hermes scarf, carried in a $2400 Gucci tote bag, to a $200,000 Mercedes that looks like an Isuzu Trooper, going to a resort featured on White Lotus, and other such fabulous things. The money that’s left will be used to make money from money. They need not do it personally. There are managers, advisors, and handlers for that. If you have more than you need to spend, you want make money from that money.
Tax cuts at the top put more money in the hands of the Investor Class.
Under Lyndon Johnson and under Trump-as-CARES-Act-president and Biden, money was being poured into what economists call the “real economy.” That’s where regular people are producing goods and services, and, in turn, are consuming those goods and services. If the real economy is growing, it makes sense to buy in, and, to a large degree, that’s where investment goes.
When the Investor Class has more money to invest—but the real economy is not growing—or not growing in proportion—or is even declining—Investors do not stop investing. If you can earn money from money it’s so logical to do so, and so foolish not to, it becomes an imperative.
The myth, the sales pitch, for tax cuts is that by putting money in the hands of the Investor Class, they’ll invest in things that make the real economy grow. But it’s an extremely rare individual who happens to know of a nearby factory with sound management and excellent products that only needs a bit of cash to expand. Or even a trustworthy short order cook who needs an investor for a food truck. Both individual and institutional members of the Investor Class will go for where it’s easy, just like buying any other type of product, to places set up for it, and they’ll respond to advertising and to pitches for investment, as with anything else. A likely choice is stocks traded on an official market. Unless it’s the first-time a given stock is sold—in an IPO or the like—only very rarely does a nickel of the purchase price go into the company where it will be used to make things, to expand, or to pay its workers. It goes to another member of the Investor Class who already owns that speculative ticket. It’s quite likely that the investments won’t even go to a specific stock. They’ll go to packages like mutual funds, index funds, and ETFs.
Now recall the classic definition of inflation—too much money chasing too few goods.
If the amount of money in the hands of the Investor Class is growing, but the real economy is not, or even if the amount of money in their hands begins to grow much faster than the real economy, it creates a narrow, targeted inflation. That money, not a change in value, pushes stock prices up. The tax cuts remain. Sometimes there are even more cuts. So still more money gets pumped into that narrow sector.
Then new investment vehicles are invented. In the 1920s they were called “trusts.” Precursors to mutual funds and their like. Brokers reach out to more people. The amount of loose capital keeps increasing. There needs to be more places and more ways to make money from money. There’s pressure for deregulation because regulations get in the way of the need for expanded ways of investing. Banks want in on the action. That’s why bank failures become such an important feature of the sequence. Though in the 1980’s bank deregulation was right there at the start. Riskier investment vehicles are sold. Nobody checks them. If it’s all going up, it must be OK. Fraud abounds.
These events seem to have different faces. In the 1920s people bought stock on 90% margins. When the crash came they jumped out of windows. The 1980’s had lots of lavish frauds. Sub-prime mortgages were the drama queens of the Crash of 2008. All just different symptoms of the same basic financial flu. Indeed, a closer look reveals that each of these cycles had multiple bubbles—stocks, real estate, commodities, banking, financial instruments, shadow banking—just in different proportions.
Economists insist that you can’t do experiments in real economies because you can’t isolate just one factor to prove that it’s causal or not. That takes us to one more event. The Taxpayer Relief Act of 1997. It gets us very, very close to the sort of standards that emulate an experiment in a laboratory.
It was a very narrow tax cut. It just cut the capital gains rate from 28% down to 20%. Most of the time people know a tax cut is coming. It’s proposed, debated, argued over, all sorts of contributions are made to legislators to influence things. Not on this one. It had no build up. It was announced, rather suddenly, on May 7, 1997. Part of the announcement was that the announcement date would be the actual start date of the new rate, though applied retroactively after the bill was passed.
The Dot.com boom was already happening. It had started at least by 1991. The big action was in the NASDAQ, the new exchange with a heavy concentration in tech stocks. May, 1997, when the tax cut was announced, marks the moment when the Dot.com Boom turned into the Dot.com Bubble, almost to the day.
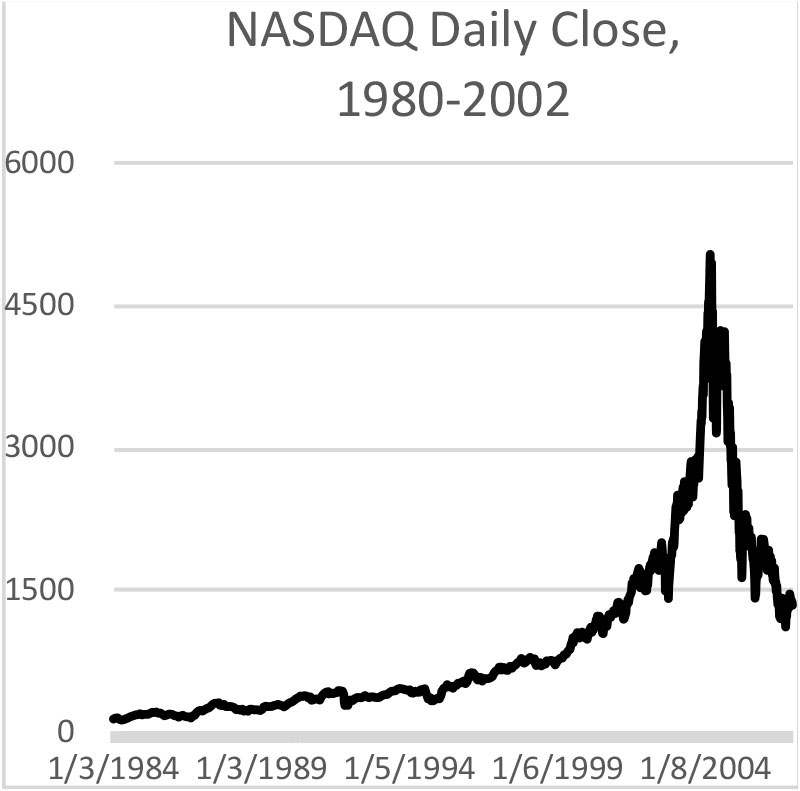
The Dot.Com Boom becomes the Dot.Com Bubble in the late 1990’s.
The NASDAQ composite is a number based on the value of all the stocks listed on that exchange. It had been going up steadily and by the mid-nineties the trajectory was increasing. In late November of 1994 the composite was at about 1,600. By May of 1997 it was around 2,800. Up 75%. Not bad. But then the graph begins to look like a rocketship . Over an equal period of time—to February, 2000—the composite goes up 318% to 8,900.
It crashed.
It went down even quicker than it went up. By October, 2002, NASDAQ shares had lost 78% of their value.
An astonishing $5.23 trillion had disappeared. $5,230,000,000,000.
A recession followed. It’s referred to in the literature as the “Early 2000s Recession.”
There’s a simplicity here. There was a Boom. It was based in the reality of the new technology. There was a tax that made that type of investment more profitable. The boom became a Bubble. Bubbles burst. There was a Crash. It did not stay confined inside the fiscal sector. It led to a Recession.
The banks weren’t involved because the sequence was so short. Two years and two months as compared to seven or eight years in the 1920s and the seven years at the start of this century.
This should be the conventional wisdom.
All the facts—tax rates, the crashes, bank failures, the depression and recession, and their dates—are easily accessible.
But it’s not.
The conventional wisdom is the opposite. That tax cuts are good for economy. If you start to look it up by subject and interpretation—like asking a search engine if the tax cuts of the 1920s were good for the economy—almost every essay you find will say that they were. Some will be like Stephen Moore’s of the Heritage Foundation who simply stops looking in 1928. See, if you close your eyes before the Crash of 1929 everything looks totally hunky-dory. But it needn’t be nearly that blatant.
If, however, you just look for the actual events—tax cuts, tax rates, booms, crashes, bank failures, recessions and such—then it’s right there.
What about economists? We live in an age of a multitude of great universities, of professionalism, PhD’s, publish or perish. Why don’t they say all this? It is impossible to say how weird economics is as a study, without sounding like a conspiracy nut and going on at book length to prove you’re not. As a group, they’ve missed or mistaken every major economic event at least since 1980. I will offer just one example.
At an estimate, there are about 45,000 working economists in the U.S. After the Crash of 2008 there were two studies that looked for economists who predicted it. It didn’t have to be to the date. It had to be in print. It had to have some reasons for the prediction. The first study found four. The second, which included European journals, found twelve. Those are impossibly low numbers. You could find more priests in the Vatican willing to disagree with the Pope, this one, or the last one, or the one before. You could get a better result by going to Madame Rosa in her storefront.
If an entire academic field was so widely wrong, you would think that they would turn to vigorous self-examination. Our theoretical airplane had a real-world crash. What did we get wrong? How must we change our thinking and procedures? Yet when I looked ten years after, it hadn’t happened.
One of the primary ways that theories are evaluated in science is the quality of their predictions.
Here come the new Trump tax cuts. Here’s my predication.
There’s a small possibility that Trump’s tariffs will bring on a crash. If that happens soon, while no crash is a good thing, it would probably have a silver lining because it will preempt the big cycle which would be much worse.
The new tax bill is a continuation of Trump’s 2017 tax cuts, but with the CARES Act gone. And Biden’s stimulus bills gone. Cutting more taxes and making new spending cuts. The distance between the Investor Class and the Real Economy will grow quickly. There will be a boom. It will look very like the Bush Boom, all the cream at the top, skimmed milk for everything below. There will be a fiscal sector bubble. The flash feature of this crash won’t be sub-prime mortgages or derivatives. They will be cryptocurrencies, the current pet rocks of finance, worth nothing but what people bet on them. There was already a series of bank failures in March, 2023 tied to the cryptocurrency bubble. Then a crash. Banks and bankers will need a huge bailout. And there will be a severe recession.
Larry Beinhart is an American novelist, columnist, and blogger. His principal concerns are the US economy and politics, taxes, and rising inequality. He is best known as the author of the political and detective novel American Hero, which was adapted into the political-parody film Wag the Dog.
- There was a $1,000 deduction for individuals, $2,000 for a couple or head of a family. Statistics for the period are quite varied and sometimes contradictory. It’s reasonable to say half of US families had incomes under $2,000 in the 1920s and were therefore essentially exempt from taxes, and the 6% tax on the first $4000 really only kicked in over $2,000 for anyone with a family. [↩]
- In The Cost of the Savings and Loan Crisis: Truth and Consequences, Timothy Curry and Lynn Shibut, FDIC Banking Review, the authors calculate from 1986-1994. They start with 3,234 thrifts, of which 1043 failed, for a failure rate of about one third. It seems more reasonable to start in 1982. If we add the data from that year until 1985, using data from the FDIC, Managing the Crisis: the FDIC and RTC Experience – Chronological Overview, we come up with the numbers cited here. [↩]
- “From January 1, 1986, through year-end 1995, the number of federally insured thrift institutions in the United States declined from 3,234 to 1,645, or by approximately 50 percent.” The Cost of the Savings and Loan Crisis: Truth and Consequences, Timothy Curry and Lynn Shibut, FDIC Banking Review [↩]
- The Origins and Causes of the S&L Debacle: A Blueprint for Reform: A Report to the President and Congress of the United States, 1993, by the National Commission on Financial Institution Reform, Recovery, and Enforcement said as much, but in the most peculiarly pretzel shaped way imaginable. In the typical large failure, every accounting trick available was used to make the institution look profitable, safe, and solvent. Evidence of fraud was invariably present … unprecedented fraud emerged … Dishonest operators flocked to S&Ls, … It is important to note that, despite the incentives and opportunities for abusive behavior, most S&Ls resisted temptations. They continued operating in a conservative and safe fashion. …. These S&Ls survived. If the honest ones survived, what were the banks that failed? [↩]
- https://www.fdic.gov/bank/historical/history/167_188.pdf [↩]
- https://www.levyinstitute.org/publications/29000000000000-a-detailed-look-at-the-feds-bailout-by-funding-facility-and-recipient/ [↩]
- https://www.macrotrends.net/1319/dow-jones-100-year-historical-chart [↩]
- In the great games of politics and blames, there are constant claims that any unemployment number is not the “real” unemployment! Usually that it’s much worse! For simplicity and comparison purposes—to compare apples to apples—we will use the standard, public numbers unless otherwise noted. [↩]
- https://www.bls.gov/spotlight/2012/recession/pdf/recession_bls_spotlight.pdf [↩]
- https://www.huffpost.com/entry/us-lost-more-than-170000-small-businesses-2008-2010_n_1702358 [↩]
- This rate kicked in on income over $200,000 for taxpayers filing singly. This equates with about $2,000,0000 in 2025 dollars if you’re calculating from 1960, and about $2,600,000 calculating from 1950. For joint filers, the rate started at $400,000, which today would be $4 million and $5.2 million. A sound argument can be made that going back to those tax rates is the only real way to Make America Great Again. [↩]


0 Comments