
Since the dawn of the internet and the concurrent surge of Fox News and right-wing talk radio, the various forces on America’s right and far right have cleverly and disingenuously labeled themselves “conservatives.” They have then successfully cemented two “big lies” in the consciousness of a majority of the American public: first, that the media in this country is an almost total captive of card-carrying “liberals” who impose their views through reporting as well as opinion; and second, that a solid majority of Americans shares the radical Social Darwinism that has been successfully peddled since the dawn of Reagan as conservative views.
The first falsehood can be—and has been—easily debunked by simply examining the even-handedness that selfsame American media applies to what it labels “Right” and—absurdly—“Left.” But the second big lie is more insidious, and has found its most receptive host among its intended target, liberals or, as current parlance now requires, “progressives.” It is the pervasive belief that America is a “conservative country.” What follows should effectively demonstrate the falsity of that view—by the carefully weighed and collated opinions of the American public.
I am not relying on my opinions. As a long-time observer of American politics, an occasional minor participant in Democratic campaigns, and a consumer of market research in my professional life, I have opinions on most issues of importance. But however strongly I may hold them, they represent what marketers call a “mother-in-law” survey. They are of zero value in assessing what the broad public thinks.
Instead, the following exegesis represents a deep dive into years of attitudinal polling results that reveal what Americans currently think on a broad range of major issues, and how that thinking may have evolved over the past several decades. There is a key distinction between election polling and issues polling. The first is subject to large imponderables: future unknown events that could change minds; legitimate mind-changing; and, of course, outright dissembling to the pollster. Asking people what they believe on a given topic is essentially removed from these variables.
I have relied on Pew Research and Gallup as my primary sources, as they offer unmatched depth of questioning in a consistent matter over decades on a uniquely wide range of issues. Occasionally, I’ve relied on other polling organizations—WSJ/NBC, CNN/ORC, NYT/CBS—when their polls presented the most on-point data. And in all cases, the most recent polling results have been cited, with historical periods selected to reveal the most significant attitudinal shifts.
What I found will surprise even close observers of the American political scene. The results conclusively demonstrate that Americans, in their deepest political/social beliefs, are thoroughly liberal in most of their views and moderately liberal in the balance. They are not the “conservatives” described by the relentless propagandists of the right. Further, while these collective views have decidedly tilted toward the more moderate-to-progressive in recent years, this reality about what Americans actually think (as opposed to whom they vote for) has been consistent since Barack Obama began his presidential campaign and on some issues well before that.
Because of the unique personas and peculiar histories of Hillary Clinton and Donald Trump, this year’s election was not, I suspect, decided by ideology per se, but on the complex elements of personality and narrative, and by angry and alienated blue-collar voters desperate to change how Washington works.
I recall precisely the day I realized just how badly we had been deceived by right-wing agitprop: November 24, 2014. Republicans had just completed their second quadrennial sweep of off-year elections, adding 13 House seats to bring them to a modern-day record of 247 members. The Senate was flipped from a Democratic majority with 55 members into a Republican majority with 54.
That day I picked up the Wall Street Journal, read the results of a WSJ/NBC post-election poll and had my Eureka moment. Respondents were asked to give their views on a range of issues that had been prominent in the Congressional elections. Here are some of the results of that post-election poll, after eliminating those who offered no opinion:
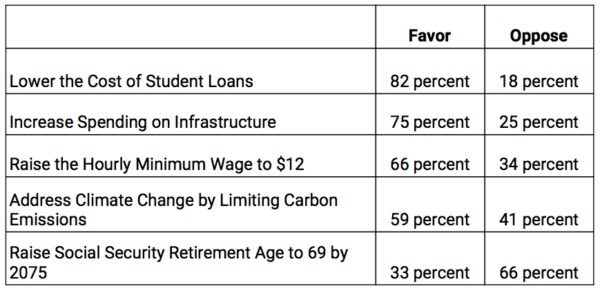
The attitudes of a substantial majority of voters seemed wildly out of kilter with the near-total support for Mitch McConnell, Paul Ryan, et al. But it was the final poll question that was most revealing: “How do you feel about the Congressional elections that just ended?” Reflecting on the landslide just delivered to a party that opposed every one of these positions polled, 53 percent of respondents pronounced themselves “happy” with the outcome, and only 40 percent said they were “unhappy.” While campaign spending limits were not raised in this WSJ/NBC poll, a Gallup poll earlier that year—four years after Citizens United came thudding down—had found that 80 percent of respondents favored strict limits on campaign spending, a finding that, per The New York Times, was true “regardless of political philosophy, party identification, age, educational attainment, sex or income level.”
It is results like these that make it tempting to agree with Bill Maher’s trenchant remark that “the true axis of evil is the stupidity of our population and the brilliance of our marketing.” However, in this article it is the wisdom of 50-plus percent that by definition will rule. By topic, here is what 20 years of polling tells us our fellow citizens think.
POLITICAL ISSUES
Party Identification—Here the oft-told tale is the rise of the Independent, with 39 percent of voters choosing that label in 2016 versus just 29 percent in 1990. A less-reported fact is that essentially all of the growth in Independents has come at the expense of the GOP, whose self-identified members now total a mere 23 percent of voters, down from 31 percent in 1990, a 35 percent drop. Conversely, Democrats have suffered a within-the-margin-of-error decline from 33 percent to 32 percent over that same 26-year stretch.
In fairness, the Indie category clearly harbors more Republican-leaners than Democrat-leaners, accounting for the relative closeness of most of our election outcomes. However, a further advantage for Democrats is revealed by the fact that in the past three presidential elections the average Democratic advantage among the 18-29 demographic was 14.7 percent compared to its share of the 65-plus demo. From 1980-2000, these two opposite age groups voted essentially the same; while this partly reflects Republican gains among older voters, this powerful shift has obvious favorable implications for Democrats in future elections. But it is how people describe their views in philosophical terms that shows the most telling long-term shift. In 1994, 30 percent of people polled characterized their political identity as either “Consistently Conservative” or “Mostly Conservative,” while 21 percent said they were either “Consistently Liberal” or “Mostly Liberal.”
When Gallup asked this same question in 2016, the Conservative/Liberal split had shifted fairly dramatically to 27 percent Conservative versus 34 percent Liberal. (The difference is a sharp decline in those professing “Mixed Views.”) While it is a commonplace to hear that we are becoming more polarized, it is a rarity to hear someone proclaim the reality: the nation self-identifies as decidedly more liberal.
Government Dysfunction—Another myth promoted by both right-wing and mainstream media is that the general public’s increasing aversion to politics applies equally to both parties.
Not so. Congressional Republicans, as of this April, received 80 percent disapproval and 12 percent approval ratings. For Democrats in Congress, it’s 63 percent disapproval/31 percent approval ratings. While neither party is in positive territory, the difference is dramatic, with a 68-point “net disapproval rate” for the Republicans more than twice that for Democrats. This compares to a poll taken in August of 2010, when both parties had equal net negative ratings of 30 percent.
Pew Research, in an attempt to get at underlying views of Republicans and Democrats, asked more than 2,200 voters this past March whether they thought each party exemplified certain traits. These were the results:
Do You Think This About Each Party?
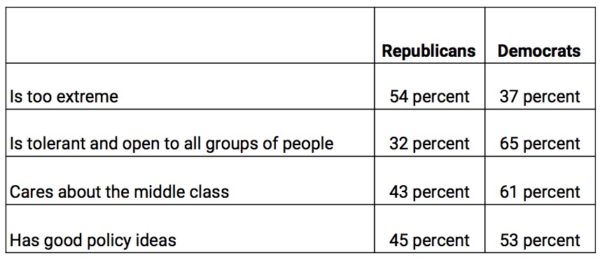
The last item is perhaps the most interesting. “Good policy ideas” had long been a strength for Republicans.
Campaign Spending Limits—Ironclad GOP control of the House has made even the most modest campaign-contribution disclosure legislation a non-starter. But how do people feel about controlling the actual level of campaign spending? A NYT/CBS poll in June of 2015 found a resounding 78 percent of respondents favored limiting spending by Super PACs, with 77 percent supporting limits on individuals. The fascinating revelation in the poll’s cross-tabs was that support of these limitations was almost as high among Republicans—as the number-one issue for Bernie Sanders actually had great support across the political spectrum.
SOCIAL ISSUES
It is on social issues—in which the American right has been deeply invested—that the most dramatic shifts in public thinking have occurred over the past 10 to 20 years. Part of this is demographics, shaped by the difference between Millennials and the fading “Greatest Generation.” But lopsided majorities now favor positions that, while once almost exclusively supported by progressives, can now be openly embraced without the fear of the ballot-box losses that haunted centrist Democrats in the ’80s and ’90s.
Same-sex Marriage—Rarely has an issue seen such a rapid and dramatic turnaround in public opinion as the American public’s views on same-sex marriage. Support for what only a few years earlier was an outlier viewpoint had, by 2013, gained the approval of 54 percent of those surveyed. By the time Gallup asked this question in 2016, a year after the Supreme Court’s landmark ruling, the ratio of support to opposition was 61 percent to 37 percent, a massive 20-year swing from the 27 percent favorable, 68 percent unfavorable view held by the American public in 1996. Gay marriage, cynically used by Karl Rove’s political operatives as a wedge issue to drive up voting by evangelicals in 2004, is now supported by almost two-thirds of Americans. One of the Republicans’ three standard “G’s”—God, Gays, and Guns—now appears to be a negative for them.
Immigration—Polling here shows that a year of campaigning by Donald Trump on this issue has driven down support for the policies he has most vocally espoused. When asked if immigrants either “Strengthen our country because of their hard work and talents” or “Are a burden on our country because they take our jobs, housing and healthcare,” a poll this March found 59 percent support for the “Strengthen” position, against 33 percent who chose “Burden.” This nearly two-to-one support for immigration compares to the 2011 Pew poll on the question, which was a tie at 45 percent. Going back to 1994, these figures were 63 percent in the “Burden” camp, with only 31 percent saying “Strengthen”—an almost complete reversal over 20 years on how Americans view immigration.
While this long-term trend is partly shaped by demographics, with Millennials and Gen X-ers lopsidedly in the “Strengthen” camp, Trump’s heated rhetoric inexplicably caused support for his extreme views on immigrants to decline. Indeed, 74 percent of all voters think there should be a way for undocumented non-criminal immigrants to remain in the country legally, with only 19 percent supporting an effort to deport them.
But it is Trump’s signature “Build a Wall” issue where polling produces the most counterintuitive results. When asked if they supported such a project in September of 2015, a few months into the Trump campaign, the public split almost evenly. But a poll taken this August showed a precipitous drop in support for this idea, to 34 percent in favor and 62 percent opposing.
Legalization of Marijuana—Here is another issue where public opinion has shifted almost as dramatically as on same-sex marriage. Gallup has been polling on this question since 1969, when opposition to making it legal was 84 percent, while only 12 percent favored legalization. By 2015, when Colorado, Oregon, Alaska, and Washington, D.C., had legalized the recreational use of “cannabis”—the industry’s preferred term—with another dozen states having approved its medicinal use, an outright majority of Americans—58 percent—favored legalization. (Note: In November eight states passed ballot measures that made marijuana more available, while Arizona narrowly defeated such a measure.)
The results will conclusively demonstrate that Americans, in their deepest political/ social beliefs, are thoroughly progressive in most of their views, moderately liberal in the balance.
Health Care—There is no other issue where the fecklessness of Democratic politicians has been more pronounced than in their failure to explain the Affordable Care Act, and to explain where the public really stands on the broader issue of how best to provide expanded health care.
Instead, the Republicans have been allowed to define the issue as some monster called Obamacare, and to further distort the debate by a ruse that could have—and should have—been easily exposed when the bill was being debated: the idea that this complex piece of legislation was opposed by a majority of Americans. It was, but only in the most technical interpretation, as 58 percent of those polled did say they “opposed” Obamacare. What its right-wing opponents knew very well, but the general public didn’t, was that this opposition had two elements: those who opposed it because it was “too liberal” and a significant minority who opposed it because it was “not liberal enough.”
This latter group was primarily people who decried the Affordable Care Act because it did not provide a single-payer system—generally defined as “Medicare for all.” Thus the opposition to the bill was divided into two very different camps; as of late 2013, 43 percent of Americans polled said they opposed the bill because it was “too liberal,” but the critical 15 percent that created the apparent 58 percent majority “opposition” were against the bill because it did not go far enough.
By the time the country had two years of experience with Obamacare, the total of solid supporters plus those who sought its expansion had grown to 58 percent, versus only 37 percent in outright opposition.
Yet the bill’s highly vocal opponents continued to claim that “a majority of Americans” opposed Obamacare, while not one Democrat, to my knowledge, made the critical case that most Americans supported the ACA’s aims. To show how far the bill’s opponents are from current thinking, a Gallup poll this May came up with a startling 58 percent in favor of a complete government-funded single-payer health care system, as advocated by Bernie Sanders and described by the media as the view of the left wing of the Democratic Party.
Views on Crime—Perhaps no other issue better reveals the divergence between fact and public perception than how people consistently misperceive trends in the crime rate. First, the actual data: Between 1990-2015, violent crimes have declined by 37 percent, with the per-capita violent crime rate down 51 percent. Murders over this period are down 37 percent in absolute terms, with the murder rate exactly half what it was 25 years ago. The larger category of property crime is down by similar proportions. So why do 60 percent to 84 percent of people responding to 30 years of annual surveys consistently say that “Crime is higher than a year ago”?
Yes, the murder and violent crime rates ticked up in 2015, from the prior year’s historic lows, while property crime continued to fall. But the right wing—and Donald Trump—have shown a remarkable ability to cherry-pick crime stats to make a misleading case for an overall upturn. The most likely reason for this disconnect is, I suspect, the fact that crime reporting on 24-hour cable news and in newspapers is not down. And there is that dystopian picture of urban life that the right wing—and most forms of popular culture—portray.
Equal Pay for Women—Here is another issue that Democrats in particular and progressives in a broader sense have failed to exploit in an electorally productive way. The facts—and underlying attitudes—are heavily on the side of those who support this concept even if the public’s views on precise legislative solutions may be less clear. However, the actions of the two parties are, once again, in total contrast: Democrats have introduced a version of the Paycheck Fairness Act in every Congress since 1998, only to see some form of Republican maneuvering thwart its passage. Its most prominent defeat came in 2014, on a straight party-line vote when every member of the then Republican Senate minority used the filibuster to defeat it despite 53 Democratic votes.
As for the public’s attitudes, a poll at that time by an admittedly Democratic polling organization (Lake Research Partners) found 84 percent support for such legislation, with 72 percent “strongly” supporting—and with even 77 percent of Republicans registering their support. Yet in the disastrous 2014 election, this potent issue was barely mentioned, as Democratic candidates preferred to trot out that shopworn statistic about “women being paid 77 cents to the male dollar.” That might be empirically true, but a fairly large percentage of voters understand that gap to be the product of 100 years of societal forces, most of them not subject to immediate amelioration by legislation.
Tax-supported Universal Child Care—There is probably no greater burden on the middle- and working-class than the cost of child care. Here is yet another area where the Democratic and Republican positions, as reflected in numerous Congressional votes and the two parties’ platforms, are diametrically (though in this case subtly) opposed. Democrats offer direct government support and tax credits, in contrast to the classic GOP nostrum of tax deductions, which would become a new entitlement for the upper-middle class and are meaningless to the majority of taxpayers who do not itemize their deductions. Once again the public, as surveyed by Gallup, gave a solid majority (59 percent) to “Free (tax-supported) universal childcare and pre-K programs,” with just 26 percent opposed.
Unsurprisingly, the party breakdown was fairly stark, with Democrats 81 percent in favor, 7 percent opposed, while Republicans came out 23 percent in favor, 70 percent opposed.
ECONOMIC ISSUES
Every four years we are told that the number one issue with the American people will be the economy. What most actual voters—and most politicians—mean by “the economy” is “How do people feel about their personal economic situation?” Clearly, the core tenet of Donald Trump’s campaign was that there is economic dissatisfaction among a very large sector—perhaps an outright majority—of voters.
But does this hold up to objective scrutiny? Fortunately we have a Gallup poll completed August 24, 2016, and its results are startling. Here, in abbreviated tabular form, are the responses of a broad sampling of workers, hourly and salaried, full-time and part-time, to the question: “How Much Money Are You Making Today, Versus Five Years Ago?” These responses should have been even more pertinent in this election year when measured against the same questions Gallup asked in 2013.
Income, Compared to Five Years Ago?
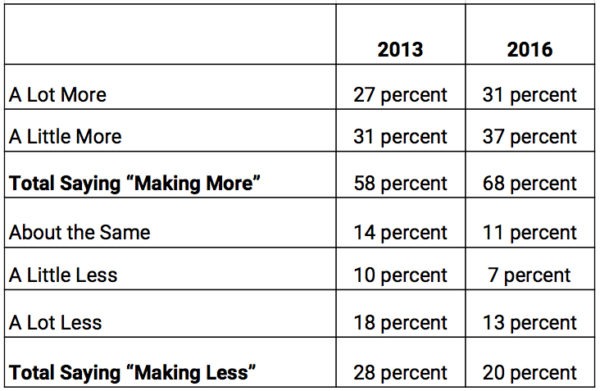
Would even close observers of the economic and political scene have guessed that almost 3.5 times as many people (68 percent) feel they are earning more today than five years ago, versus those (20 percent) who think they are earning less? (Or that, under Obama, unemployment among those with high-school degrees or less has gone from 11.8 percent to 6.5 percent.)
Minimum Wage—In that 2014 Republican sweep election, there were four states—all solidly red—that had ballot initiatives on raising the minimum wage. Those measures passed with majorities ranging from 54 percent in South Dakota to 69 percent in Alaska—in a year when all but one of 42 Republican Senators joined a successful filibuster against a Democratic bill to raise the hourly federal minimum wage to a modest $10.10, their opposition prevailing over 53 Democratic Senators. The simplest expression of public opinion here can be seen in the previously cited 2014 poll: 66 percent favoring an increase to $12, with even a raise to $15 an hour now getting a 52 percent positive response. (Note: This November voters in Arizona, Colorado, Maine, and Washington approved measures increasing their minimum wage rates, by amounts ranging from 43-60 percent, while 71 percent of South Dakota voters refused to lower their $8.50 minimum wage to $7.50 for teenagers.)
Of course the tiresome Chamber of Commerce rebuttal always invokes how “small businesses” would be hurt and the hiring of teenagers and minority workers depressed. Here, once again, polling results are available to show that the general public doesn’t buy these tired shibboleths, already disproven by comparisons of neighboring states with differing minimum wages. In July of 2015, a group called the Small Business Majority polled the owners of small businesses around the country. The results showed that 60 percent of them supported raising the hourly minimum wage from its present $7.25 to $12, with 75 percent of those in favor saying they “strongly supported” this 60-plus percent increase.
Taxation Fairness—One issue that has faded from its former prominence in the minds of voters is tax reductions, long ago brilliantly rebranded by the right as “tax reform.” Trump uncovered an obvious lack of enthusiasm among angry working-class whites for any further reductions in marginal tax rates on the rich and the super-rich. Yet this has not dimmed the enthusiasm of the Republican Party, and indeed Trump himself, for proposing substantial, upper-bracket-weighted tax reductions. Yet 64 percent of all respondents (and 52 percent of those identified as Republicans) are “bothered a lot” that corporations “don’t pay their fair share” of taxes. And 61 percent of all respondents, including 45 percent of Republicans, were equally bothered that “Wealthy People” don’t pay their fair share.
Of more amusement value than surprise was the 33 percent of Republicans who responded that they were “bothered a lot” that “Poor People” didn’t pay their fair share. Yet a Gallup survey released on Tax Day of this year confirmed that tax reduction has declining potency as an issue. It found that 51 percent of those polled considered their own taxes “too high”—down from 65 percent giving that response in 2001. This indicates, I believe, that back in the heyday of Republican tax-cutting, the average voter viewed such plans as “great—my taxes will be cut.” Today, it is far more likely to be heard as: “They want to cut some fatcat’s taxes, not mine.”
Global Warming/Climate Change—The right has cleverly pitched its opposition to combating climate change as a defense of economic growth. Their argument that progress on one front can only be achieved by a serious cost on the other is even more wrong than usual, yet provides some cover for the climate-change denial that is almost required of every Republican officeholder. Yet this easily refutable position has been met with a strange unwillingness by Democrats to go beyond bland nostrums about the need to treat the issue seriously, leaving unanswered the claim that addressing climate change can only come at unacceptably high direct and indirect economic costs, or that the carbon cap-and-trade scheme once offered by Republicans only became anathema when championed by President Obama.
Democratic candidates should consider what the mass of voters, rather than Republican climate-change-deniers, think about this subject. Some 59 percent told WSJ/NBC pollsters in 2014 that they felt strongly enough about climate change to support limiting carbon emissions. When asked by Gallup this year whether they worried about global warming “A Great Deal” or “A Fair Amount,” 64 percent answered “A Great Deal,”while 36 percent who responded said they worried “Only a Little” or “Not at All.” This would appear to be an arena where voters would respond favorably to serious proposals that show how to reconcile economic growth with a reduction in man-made carbon emissions.
INTERNATIONAL ISSUES
Attitudes Toward Free Trade—Thanks to Bernie Sanders and Donald Trump, in their very different ways, an issue that had been considered a fringe motivator became a subject of public debate this election year. A poll of economists, who obviously have some grasp of the subject matter, would yield a 90 percent-plus vote in favor of “free trade.”
To the average citizen, the concept is less clear. Pew Research conducted a poll in August asking a fairly simple question: Do You Think Free Trade Is Good or Bad? The result was a near-even split between 37 percent saying “Good” and 39 percent selecting “Bad.” Rather telling was the 24 percent who opted for “Don’t Know.” Republicans and Republican-leaners fell into a 61 percent “Bad,” 32 percent “Good” split, while Democrats and Democratic-leaners came out at 58 percent “Good,” 34 percent “Bad.” This issue does not, however, present a clear-cut right-left division, as free-trade opponents occupy both extremes of the political spectrum.
Increased Defense Spending—Getting at underlying public attitudes toward America’s military posture at a given moment is not simple, with views often being influenced by which party occupies the White House. But how Americans see either increasing or decreasing defense spending is a reasonable proxy for whether a given individual wishes to see the United States expand or contract its overseas involvement. Snapshots taken by Pew Research this year and in 2011 provide a particularly useful insight into this issue, as 2011, in retrospect, can be seen as the high-water mark of support for American withdrawal from its extended overseas commitments. In comparison, this year’s primary season saw strong demands by all 16 Republican presidential hopefuls, save Rand Paul, for a large increase in defense spending.
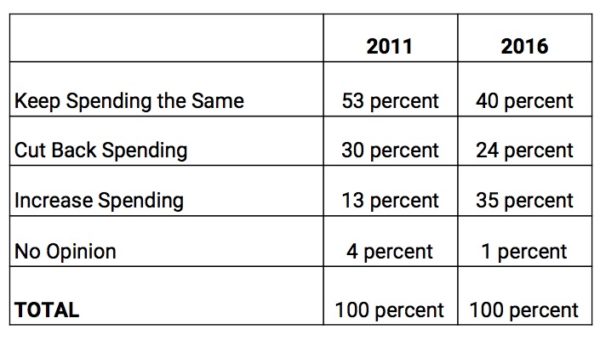
While support for either reducing defense spending or maintaining it at current levels fell from 83 percent to 64 percent in the past five years, those two choices were still favored by 80 percent of Democrats and a solid majority of Independents. Clearly, ISIS and the Syrian crisis have diminished the public’s ardor for a retrenchment in our overseas commitments. But the most striking conclusion to be drawn from these numbers is that, even today, only one out of three Americans wants to see an increase in defense expenditures—a fundamental tenet embraced by Trump and almost all Republicans.
Who Do Americans Trust to Handle Foreign Policy?—This question had always been the Democrats’ achilles’ heel. In 1994, voters rated Republicans the safer choice, by 47 to 28 percent over the Democrats. In 2000, before 9/11, the GOP advantage stood at a narrower but still comfortable 37 percent to 30 percent. It took George W. Bush, and the widely accepted conclusion that the Iraq War was a disaster, for Democrats to come out on top by 2008, with a striking 48 percent to 35 percent advantage. But by this September, the Republicans had regained the upper hand, as Gallup found 47 percent of Americans trusting them better to handle foreign policy, versus 40 percent naming the Democrats.
THORNY ISSUES
Abortion—It is now 43 years since Roe v. Wade came down. After an initial 10-year period of surprisingly passive acceptance of the decision as the law of the land, the right—particularly the evangelical right—in the 1980s discovered its usefulness as a wedge issue. This has led to a hardening of positions on both sides. The right has done an effective job of dishonestly presenting its viewpoint as that of a growing majority, while using dishonest political coinages such as “partial-birth abortion,” and defining advocates of a woman’s right to choose as supporters of “abortion on demand.”
Looking at the polling data back over decades, one quickly sees that asking people to self-identify as either “pro-choice” or “pro-life” is a fool’s errand. But one can come to some solid conclusions about public opinion on this complex subject if one breaks responses regarding the desired legality of abortion into not two groups but four:
Those who favor abortion being:
• Always legal
• Legal under most circumstances
• Illegal in most cases
• Always illegal
Over the years, Gallup has found little variance in support for the two camps—when the first two categories are combined and weighed against the combination of the second two. Thus, Pew Research found that 57 percent of Americans polled in 1996 and 56 percent in 2016 said abortion should be legal either “Always” or “In Most Cases,” while those who responded that it should be either “Illegal Always” or “In Most Circumstances” totaled 40 percent in 1996 and 41 percent now. Thus the pro-choice camp has maintained a steady and solid advantage. Even the heated topic of federal funding of Planned Parenthood, despite the intense recent efforts of its opponents, gets a 58 percent thumbs-up.
Today, one of the Republicans’ standard “G’s”—God, Gays, and Guns—has been turned into a solid negative for them.
So where does that leave politicians seeking to balance reasonable policy and political risk? I think it lies in winning over most of the group that wishes to see abortion limited to only a few circumstances (the biggest single sector at an average 36 percent over the past five years) and who are repelled by the absolutist stance of nearly every major Republican politician. This year’s GOP platform avoided spelling out the landmine issues of abortion in the cases of rape or incest, but 59 percent of people polled think abortion should always be permissible in these two extreme circumstances. At the same time, the ironclad opposition by many on the left to any restrictions on abortion is a liability for candidates. The banning of “partial-birth abortion” (or its correct medical description “late-term abortion”), which is already prohibited in 16 states, is supported by 64 percent of potential voters, including 59 percent of Democrats. The reluctance of many progressives to recognize that steady advances in neo-natal science make the failure to support third-trimester bans in all cases except the life of the mother a time bomb for Democrats.
Gun Control—There is no issue where defining the morally correct position and the politically effective stance is a harder needle to thread. You may ask if people favor such measures as requiring background checks at gun shows or for online sales (85 percent do), or if sales to the mentally ill should be banned (a surprisingly lower 79 percent say yes), or if there should be a federal database of gun sales (70 percent are in favor). But these statistics regarding support for specific forms of gun control legislation reveal little about where people actually stand. To discern that, we are grateful once again to Pew Research for asking in July of 2015: Which is more important to you: 1) to control gun ownership or 2) to protect the right to own guns? When forced to choose, 50 percent considered control of gun ownership more important, while 47 percent responded that protecting gun rights was more important.
Capital Punishment—While there is not yet majority support for the liberal position of abolishing state executions, recent polling shows it is tantalizingly close. A poll released by Pew this September showed only 49 percent of respondents favoring capital punishment, with 42 percent opposed—a dramatic swing from the 80 percent support, 16 percent opposed split in 1995. Solid majorities of both Independents and Democrats oppose capital punishment, with only the 72 percent of Republican supporters keeping the overall total marginally in favor of its retention. Eleven states, comprising 26 percent of the nation’s population, have since 2000 either legislatively abolished capital punishment or subjected it to a moratorium imposed by government. (Note: In the November election, Nebraskans voted to overturn their legislature’s abolition of the death penalty, while Oklahoma voters resoundingly endorsed its retention. California sent a mixed signal, defeating a ban on executions while narrowly passing a ballot measure that moderately reformed the process. California, with 750 inmates on death row, has not executed anyone since 2006.)
CONCLUSION
There is a clear conclusion to be drawn from this deep dive into the polling data regarding what Americans truly believe about an enormous range of issues: despite the right wing having cleverly and dishonestly sold the public on the idea that this is a “conservative” country, the clear majority is most definitely progressive. The most eager purchasers of this skewed view of our polity have been Democratic politicians and the Democratic Party itself. While Bill Clinton and the Democratic Leadership Council may have been reading the tea leaves more or less correctly in 1995 when they moved the party toward the center, there is unquestionably a solid majority support for broadly progressive views in America today. This means that there should be a solidly progressive electoral majority, enough to not just elect a Democratic President, but also a Democratic majority in the Senate. The House, due to brilliant post-2010 GOP gerrymandering, requires by expert estimate about a 7 percent greater Democratic vote just to ensure a 50-50 split, and that may be a bridge too far for at least one or two more election cycles. Should we ever again have a “normal” election, it is my hope—and my belief—that these realities about what Americans truly believe will, at long last, assert themselves.
Post-election Afterword: I completed this article months before the election, expecting a different outcome. Neither I nor the editor expected to find ourselves having to justify how the views of a clear majority of Americans on nearly every major political, economic, and social issue could possibly be rationalized with the results of the election, which Trump won in the Electoral College, although trailing Hillary Clinton by approximately 2.8 million votes.
My hope is that this presentation of the underlying views of a majority of Americans will enable readers to oppose the false prophets of further accommodation with the right, and to arm themselves with the knowledge that time, demographics, and the American people are on the side of progressives. Reconciling the views of Americans with how they vote I will have to leave to others. —R.S.
Roger Smith worked at the precinct level in New York in the 1960s on both of John Lindsay’s successful mayoral campaigns and in 1972 co-chaired the spectacularly unsuccessful “Wall Street for McGovern” organization. He also worked for Senator Frank Church’s presidential bid in 1976. During the ’70s, he wrote a series of financial articles for Playboy under the nom de plume John B. Tipton. Over the past two decades, his journalistic focus has been on the media and entertainment industry, including a biweekly column in Variety on the economics of all aspects of entertainment—“It’s Only Money”—from 1999-2001. His politics have been unapologetically liberal all these years.